Articles
20,736 exposures later: Apple Log holds the same curve on iPhone 15–18 Pro
In the previous article we wrote that Apple Log is a documented, stable contract, with a known and repeatable curve. But our background in filmmaking demands that we verify rather than assume.
So we tested our assumption the same way we run camera tests before shooting a film. The assumption: only Apple Log is stable and consistent with real-world luminance.
The first question we asked ourselves was: how do you test a device’s signal in a scientific, repeatable way? An iPhone isn’t a cinema camera. It wasn’t designed as a professional tool. It’s a huge Swiss Army knife that, used well, can be very useful in many different fields. We had to rule out every app on the market because they weren’t reliable for testing. Not because they’re poor quality: some of them are excellent. But any app might introduce its own signature into the image processing pipeline.
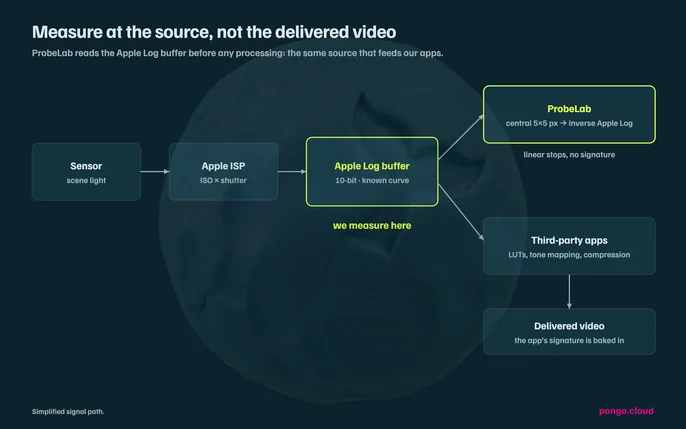
We needed to test the devices’ untouched output. We had to draw from the source, not from finished video files. And that source then had to be exactly the same one that would feed our apps. It took months of work, tests, corrections and changes to the test setup, but we finally reached our goal. We now had our own app that gave us a consistent Apple Log source, with no additional processing. Repeatable, solid and therefore reliable for testing the signal. Building this app went hand in hand with building the physical test setup: figuring out which lights to use, at what intensities, and what to frame.
After 5 months, our ProbeLab (a terrible name, but we’re human and preferred to spend our brainpower on development rather than on naming it) was ready and delivering its first results. An experienced eye could already work out how iPhones behave across the various formats. Now that intuition was backed by detailed scientific measurement. Our measurements are more than an order of magnitude more accurate than the camera tests usually run on a cinema camera before a film.
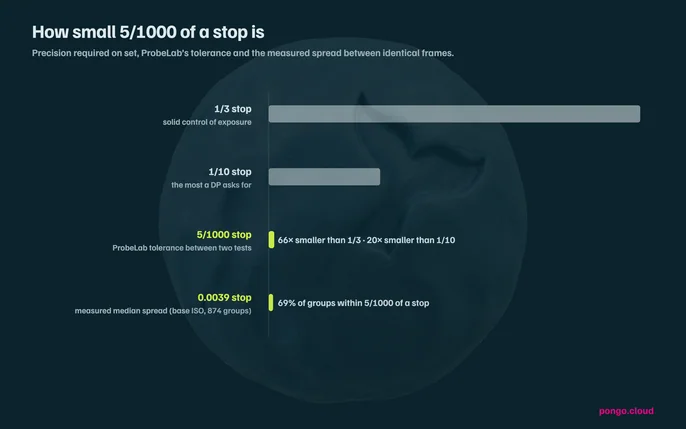
In creative work, 1/3 of a stop is enough for good control over exposure, and 1/10 of a stop is spot on. ProbeLab’s margin of error when analysing Apple Log is 1/200 of a stop: 20 times finer than the tightest tolerance a cinematographer works to on a film. So if two identical tests differed by more than 1/200 of a stop, ProbeLab flagged it and stopped the measurement.
This extreme precision is pointless when you’re actually using a light meter. But we needed it to make sure external conditions didn’t change in the slightest from one test to the next. A lamp’s intensity can shift minutely within fractions of a second. Its output can drop over its lifetime. The mains supply might have a tiny flicker. And when you’re testing at extremely short shutter speeds, you have to be sure the values differ because of the device, not because of external factors.
What did we find?
- Apple Log has a consistent curve across all devices and in real-world scenes
- iPhones follow this curve the way a train follows its track: they never derail, and they always arrive at the same stations
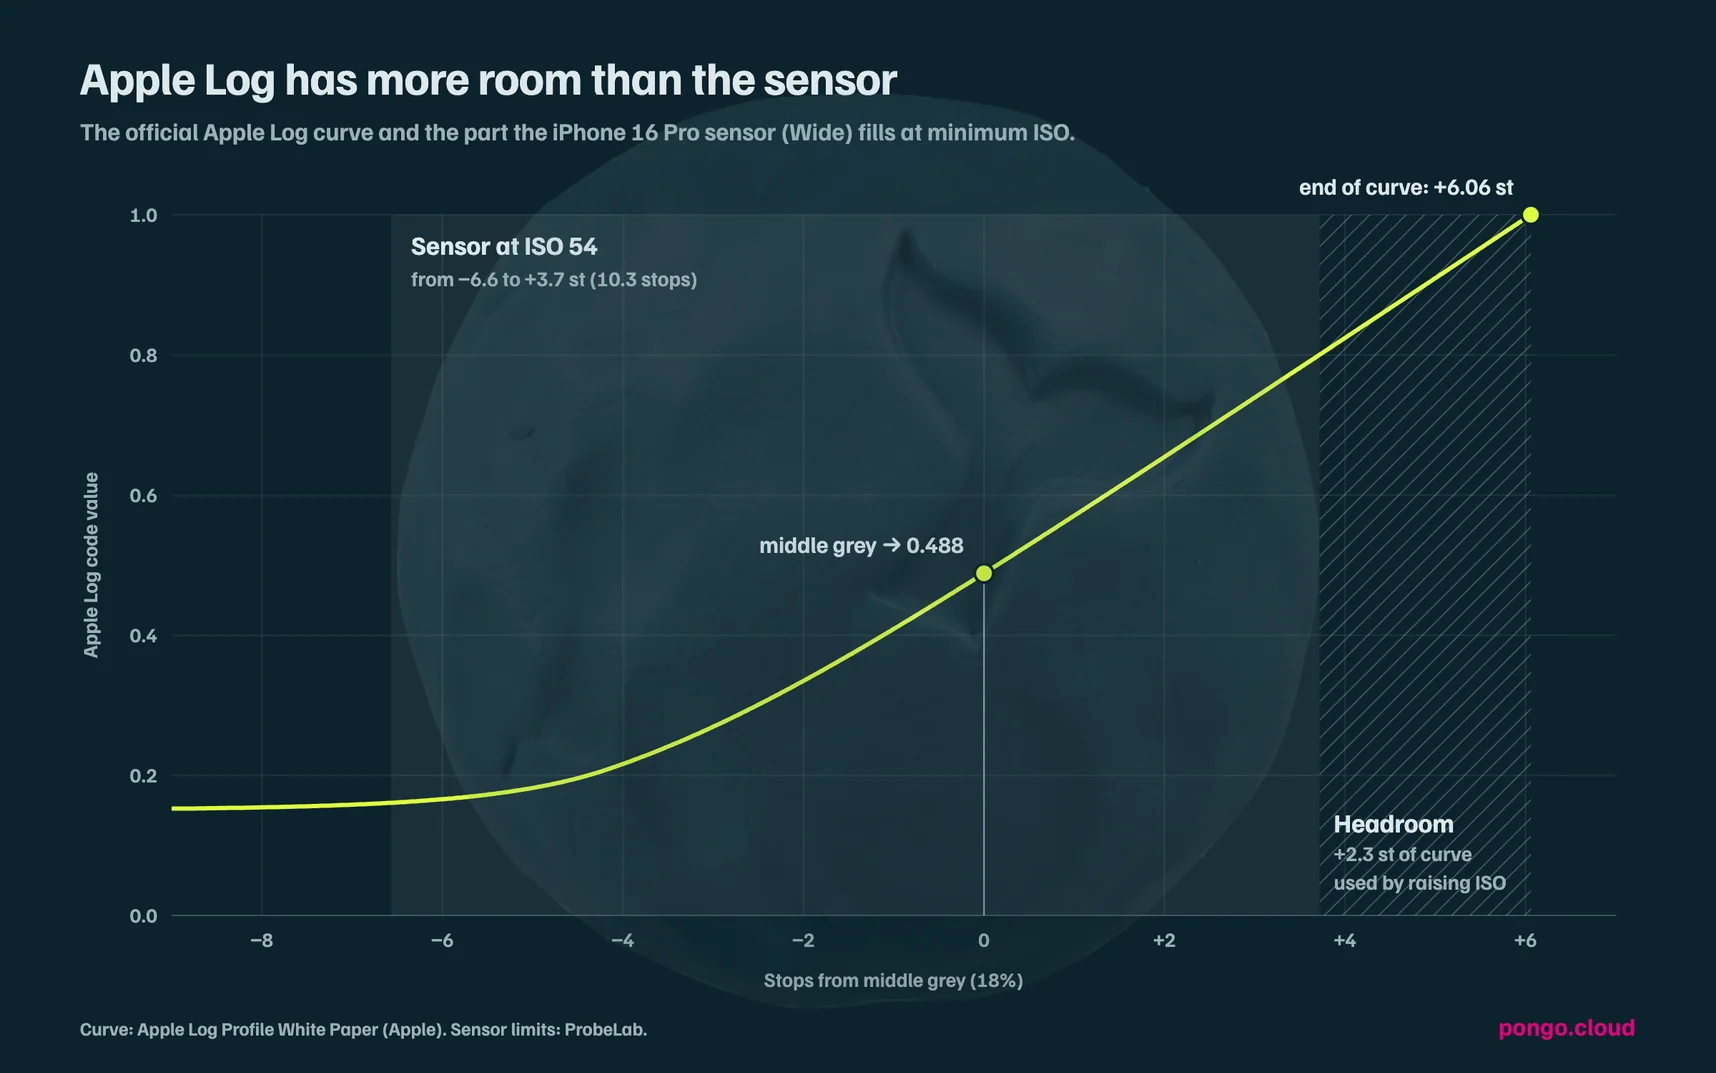
- The curve holds more than the sensors can capture: Apple uses the extra room to distribute the sensor’s range above and below middle grey deterministically, depending on the ISO and shutter speed combination
- The ISO values are not equivalent to film ISO. So we also had to build a conversion table between the devices’ nominal values and their film equivalents
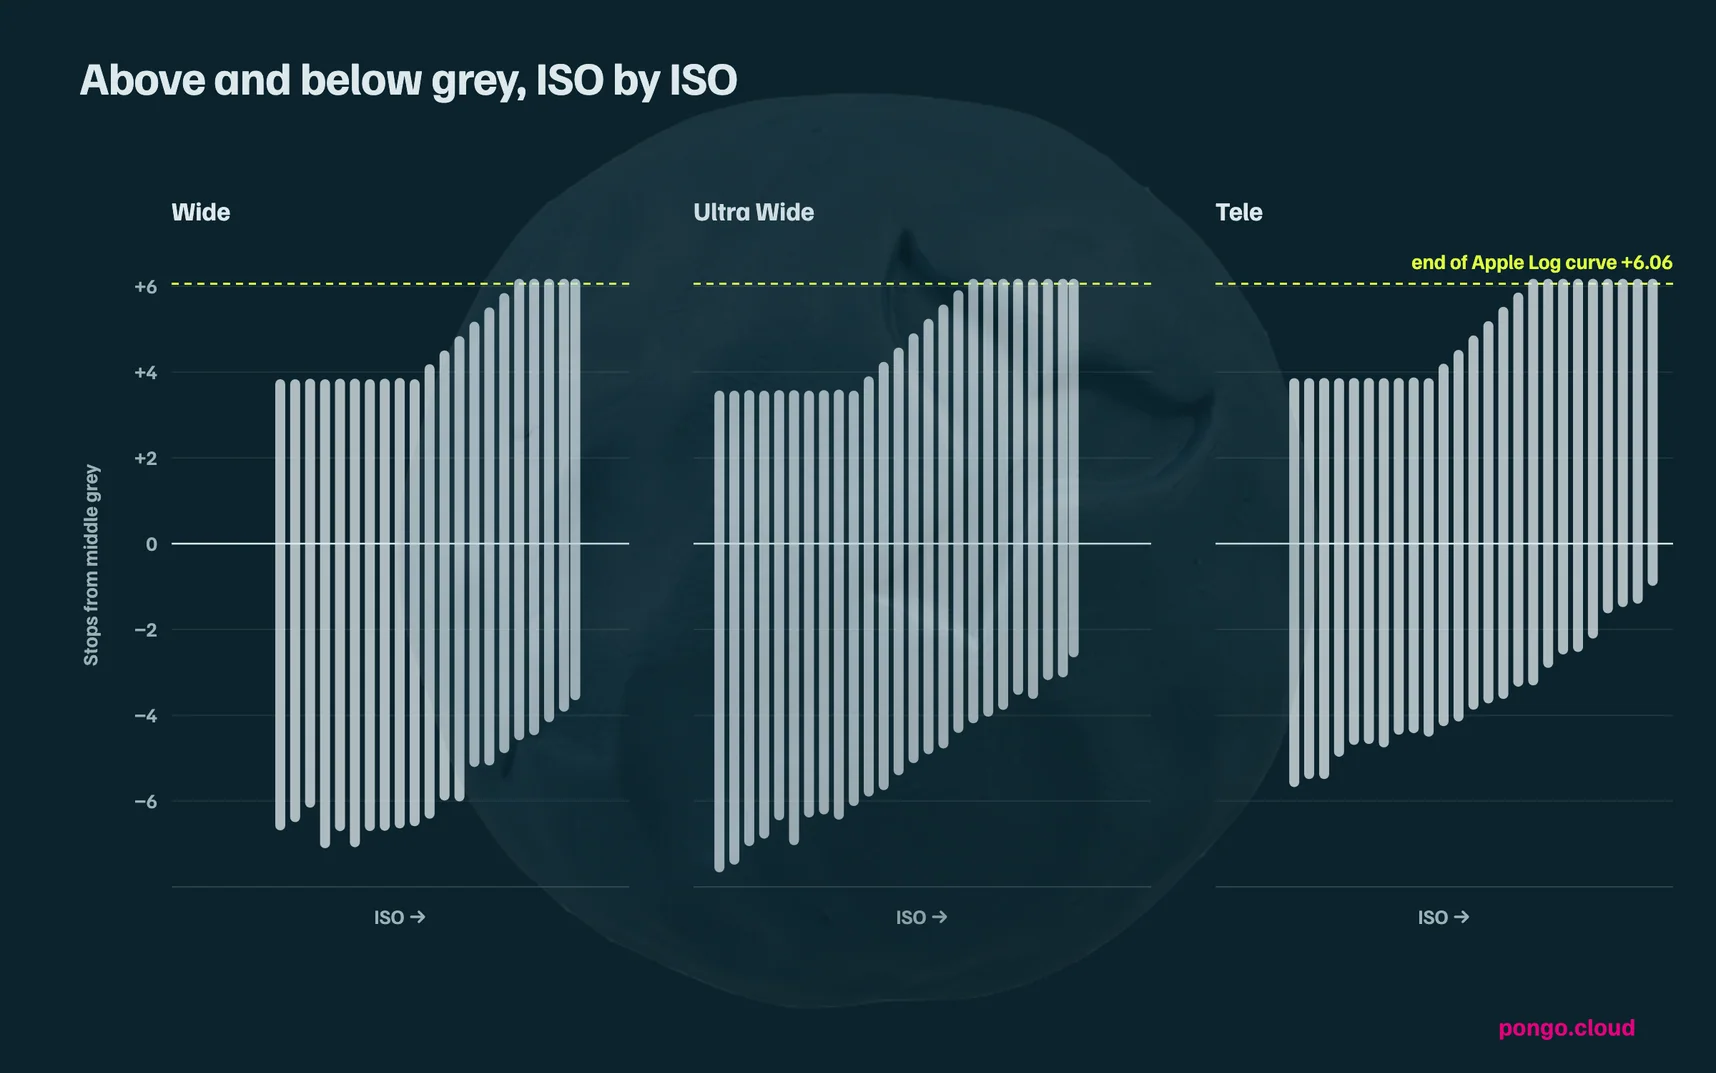
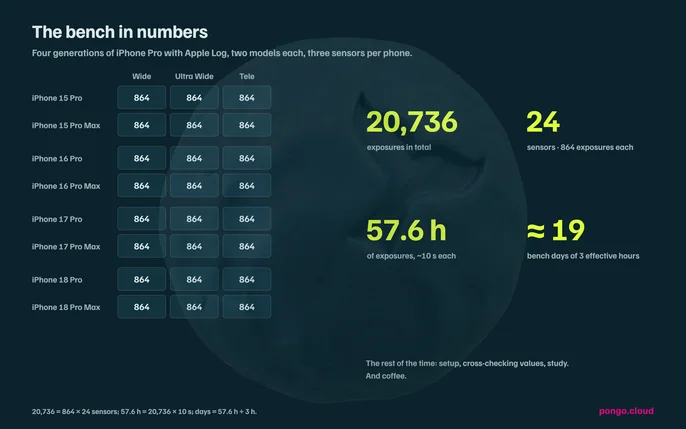
Finally, a few numbers: 20,736 exposures in total, or 864 per sensor. Each iPhone Pro has 3 sensors. Apple Log is available on the iPhone 15, 16, 17 and 18 Pro and Pro Max. At an average of 10s per exposure, that comes to about 57.6 hours of testing. On a test day we managed an average of 3 hours of actual testing. The rest of the time went on adjusting the setup, and on comparing, studying and cross-referencing the extracted values. And on drinking lots of coffee. We’re a small studio with high standards.